Scroll through any dividend-income YouTube channel or forum and JEPI, JEPQ, and QYLD come up constantly. Their appeal is obvious: double-digit distribution yields paid out monthly. What gets glossed over more often is what a covered call strategy actually gives up in exchange for that income. This piece compares JEPI (JPMorgan Equity Premium Income ETF), JEPQ (JPMorgan Nasdaq Equity Premium Income ETF), QYLD (Global X NASDAQ 100 Covered Call ETF), XYLD (Global X S&P 500 Covered Call ETF), and RYLD (Global X Russell 2000 Covered Call ETF) on expense ratios, distribution yield, actual total return, and volatility.
The earlier entry in this series, our comparison of US dividend aristocrat and dividend growth ETFs, ranked funds by how long they had raised payouts. Covered call ETFs are a different animal entirely — their income comes from selling call option premium, not from earnings growth. A head-to-head look at Korea-listed covered call ETFs (TIGER US Nasdaq 100 Covered Call, KODEX US S&P 500 Covered Call, and similar synthetic-replication products) is planned for the next entry in this series.
1) The Five ETFs at a Glance
All five carry the “covered call” label, but their underlying assets and option-writing coverage differ sharply. JEPI and JEPQ are actively managed funds that write calls on only a portion of assets through equity-linked notes (ELNs), while QYLD, XYLD, and RYLD are passive index funds that sell calls against 100% of their index exposure.
| Ticker | Issuer | Underlying Index/Assets | Expense Ratio | AUM | Holdings | Character |
|---|---|---|---|---|---|---|
| JEPI | J.P. Morgan | Low-volatility S&P 500 names + ELNs | 0.35% | $46.3B | 127 (as of 2026-09-18) | Actively managed, writes calls on only part of the portfolio, preserving some upside |
| JEPQ | J.P. Morgan | Nasdaq-100 names + ELNs | 0.35% | $42.77B | 110 | JEPI’s Nasdaq counterpart, much heavier mega-cap tech weighting |
| QYLD | Global X | Cboe NASDAQ-100 BuyWrite V2 | 0.60% | $8.32B | 104 | Sells calls against 100% of Nasdaq-100 exposure, gives up most of the upside |
| XYLD | Global X | Cboe S&P 500 BuyWrite | 0.60% | $3.36B | 507 | Sells calls against 100% of S&P 500 exposure, lower volatility than QYLD |
| RYLD | Global X | CBOE Russell 2000 BuyWrite | 0.60% | $1.37B | 11 direct holdings (indirect exposure via RSSL) | Small-cap covered call writing, highest volatility and drawdown of the five |
Two things stand out here. First, JEPI and JEPQ charge 0.35% (as of 2026-09-18, StockAnalysis) versus 0.60% for QYLD, XYLD, and RYLD — unusual, since active funds typically cost more than passive ones, not less. Second, RYLD’s “11 holdings” figure is misleading on its own: it holds Global X Russell 2000 ETF (RSSL) at a 102% weight, meaning it indirectly captures the full Russell 2000 rather than concentrating in a handful of names.
2) The Fee Trap — Headline Expense Ratio vs. Real Cost
On expense ratio alone, JEPI and JEPQ look 0.25 percentage points cheaper than QYLD, XYLD, and RYLD (as of 2026-09-18, StockAnalysis). What that comparison misses is that for covered call funds, the share of the portfolio with calls written against it functions as a hidden cost. QYLD, XYLD, and RYLD sell calls against 100% of their index exposure to maximize premium income, but that means giving up nearly all of the underlying index’s upside in a rally — an opportunity cost that never shows up on a fee table. JEPI and JEPQ, by contrast, write calls on only part of the portfolio, preserving some upside, but sit in an awkward middle ground: cheaper than the fully-covered index funds, yet still pricier than a plain index ETF.
For US-based investors, distributions from all five funds are generally taxed as ordinary income given the option-premium component, and tax treatment depends on individual circumstances — consult the fund’s official tax documentation or a tax professional rather than relying on this article for tax guidance. Investors accessing these funds from outside the US should also factor in currency conversion costs and their home country’s withholding tax treaty with the US, since neither is reflected in the headline expense ratio.
3) Concentration — Top 5 Holdings Compared
| Rank | JEPI (2026-09-18) | JEPQ (2026-09-18) | QYLD (2026-09-18) | XYLD (2026-09-18) |
|---|---|---|---|---|
| 1 | Microsoft 1.94% | NVIDIA 7.26% | NVIDIA 8.54% | NVIDIA 8.24% |
| 2 | Apple 1.93% | Apple 6.62% | Apple 7.82% | Apple 7.55% |
| 3 | Meta Platforms 1.91% | Microsoft 5.07% | Microsoft 5.84% | Alphabet (GOOGL) 5.62% |
| 4 | Amazon.com 1.87% | Alphabet (GOOG) 4.83% | Micron Technology 5.05% | Microsoft 5.61% |
| 5 | NVIDIA 1.87% | Micron Technology 4.80% | Amazon.com 4.36% | Amazon.com 3.83% |
The standout figure here is JEPI’s top-10 concentration of just 18.29% (as of 2026-09-18, StockAnalysis) — far lower than the other four. JEPQ (42.85%), QYLD (48.12%), and XYLD (39.08%) all put NVIDIA and Apple in the top two spots, reflecting heavy mega-cap tech exposure, while JEPI spreads Microsoft, Apple, Meta, Amazon, and NVIDIA evenly around the 1.8-1.9% mark. That’s a direct result of JEPI’s “low-volatility S&P 500 subset” methodology, and it means that despite sharing the “covered call ETF” label, JEPI carries a meaningfully different risk profile than index-replicating funds like QYLD or XYLD.
4) Returns Across Time Horizons
| Ticker | 1-Year Total Return | Distribution Yield (TTM) | 3-Year Annualized | Annualized Volatility |
|---|---|---|---|---|
| JEPI | 7.02% | 7.99% | 8.97% | 9.9% |
| JEPQ | 18.54% | 10.92% | 20.06% | 13.7% |
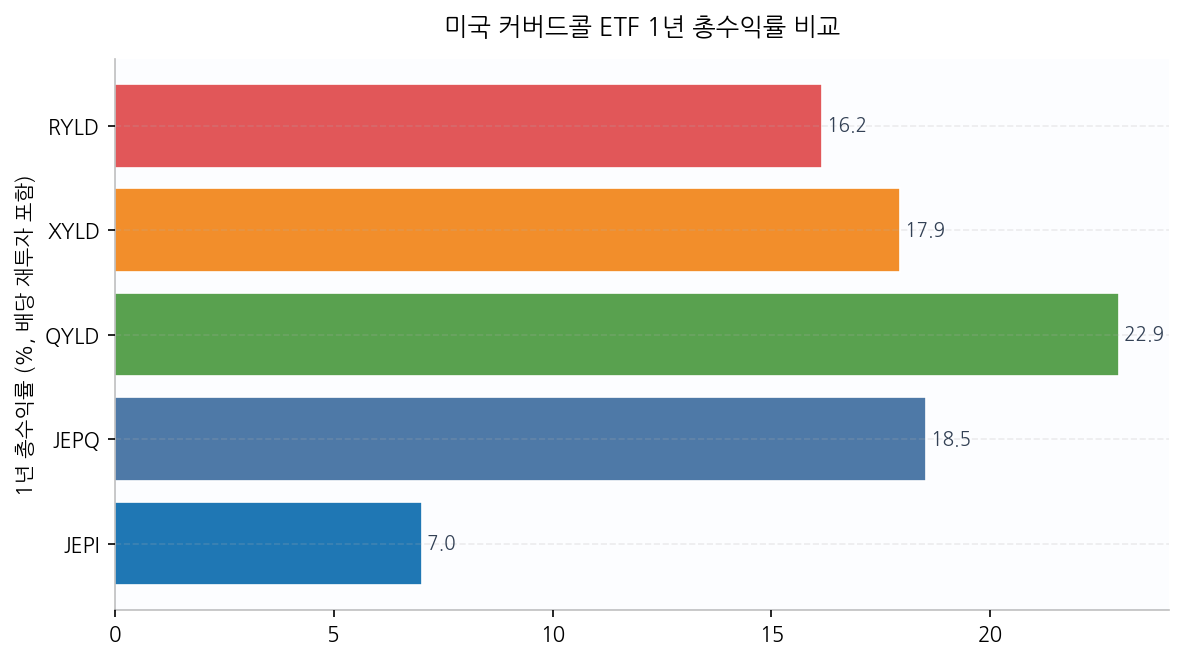
| QYLD | 22.94%-23.01% | 11.49%-11.62% | 15.83% | 10.6%-11.4% |
| XYLD | 17.94% | 10.44%-11.49% | 12.82% | 11.9% |
| RYLD | 16.16%-16.31% | 11.62%-11.91% | 8.65% | 14.8% |
By 1-year return alone, QYLD leads at 22.94% (as of 2026-09-18, StockAnalysis) while JEPI trails at 7.02% (as of 2026-09-18, StockAnalysis). Reading that gap as “QYLD is simply the better fund” would be a mistake — the past year was a Nasdaq-100 bull run, and QYLD, which holds the full index and layers calls on top, captured that rally almost entirely. JEPI, which screens for low-volatility names and writes calls on only part of the book, was structurally always going to lag in a strong uptrend. Volatility tells a broadly similar story in reverse: JEPI’s 9.9% is the lowest of the five and RYLD’s 14.8% (both from MarketXLS, as of 2026-09-18) is the highest, so return ranking and volatility ranking tend to run in opposite directions — though not perfectly, since JEPQ and XYLD hold the same relative order in both lists rather than swapping.
5) Risk Analysis
Risk across these five funds breaks into three distinct layers: the structural trade-off of missing rallies, payout-ratio sustainability questions, and fund-specific structural weak points.
- Upside participation risk: QYLD, XYLD, and RYLD write calls against 100% of index exposure, so in a sharp rally they hand back most of the gain. In flat or declining markets, that same structure provides a partial cushion via premium income — the trade-off resets every month.
- Payout ratio risk: JEPQ’s payout ratio is 362.04% and QYLD’s is 380.35% (both as of 2026-09-18, StockAnalysis), meaning distributions far exceed net income. That is not inherently alarming for a covered call fund — option premium and a portion of principal are blended into the distribution by design — but a “11% yield” headline should not be read as equivalent to a stable dividend stock’s payout.
- RYLD’s drawdown depth: RYLD’s maximum drawdown since its 2019 listing is -42.5% (MarketXLS, as of 2026-09-18), notably deeper than XYLD’s -34.1%. Small-cap Russell 2000 names carry higher economic sensitivity than large caps, and with upside already capped by the option overlay, downturns hit twice as hard.
By beta, QYLD sits at 0.61 and RYLD at 0.53 (both as of 2026-09-18, StockAnalysis), which reads as lower market sensitivity on paper. But beta doesn’t distinguish between up moves and down moves, and the underlying reality is asymmetric: these funds rise less in rallies while still participating meaningfully in declines. JEPQ’s P/E ratio of 32.24 (as of 2026-09-18, StockAnalysis) is the highest of the five, meaning a Nasdaq-100 valuation reset could outpace what call premium alone can offset.
6) A Note for Non-US Investors: Access and Tax Structure
Investors outside the US accessing these five funds directly through a US brokerage account face a different cost stack than domestic investors: currency conversion spreads on both the purchase and the monthly distribution, plus whatever withholding tax rate applies under their home country’s tax treaty with the US. Several markets, including Korea, also list synthetic (swap-based) covered call ETFs that replicate similar Nasdaq-100 or S&P 500 buy-write strategies without direct currency exposure — but those products introduce counterparty and swap-cost variables that a directly-held US ETF does not have. A detailed comparison of those Korea-listed alternatives against JEPI, JEPQ, and QYLD is planned for the next entry in this series.
7) Conclusion — Which Fund Fits Which Investor
- Want lower volatility alongside decent income: JEPI — its 9.9% volatility (as of 2026-09-18) is the lowest of the five, and its top-10 concentration of 18.29% is the most diversified. The trade-off is a 1-year return of just 7.02%, the lowest of the group — the price of that stability.
- Want yield and growth together: JEPQ — a 10.92% distribution yield paired with a 20.06% 3-year annualized return (both as of 2026-09-18), the best 3-year figure among the five. The flip side is 13.7% volatility and a 32.24 P/E, making it the most exposed to a Nasdaq-100 pullback.
- Want the most predictable monthly premium income: QYLD or XYLD — writing calls against 100% of index exposure produces the most consistently high distribution yield, in the 11% range. The structural cost is giving up most of the underlying index’s upside in a rally, on top of the 0.60% expense ratio.
- Approach with caution despite the high yield: RYLD as a standalone holding — its -42.5% maximum drawdown since inception is the deepest of the five, compounded by small-cap Russell 2000 cyclicality. Rather than chasing its 11.62% yield in isolation, pairing it with XYLD or QYLD to add large-cap exposure is the more balanced approach.
FAQ
Q1. JEPI/JEPQ and QYLD/XYLD/RYLD are all called “covered call ETFs” — what’s actually different?
JEPI and JEPQ are actively managed funds that write calls through ELNs on only part of the portfolio, which is why JEPI’s top-10 concentration is just 18.29% (as of 2026-09-18, StockAnalysis). QYLD, XYLD, and RYLD are passive index funds that write calls against 100% of their index exposure, giving up far more upside in exchange for a higher, roughly 11% distribution yield.
Q2. If the yield is over 10%, isn’t the fund eroding its principal?
JEPQ’s payout ratio is 362.04% and QYLD’s is 380.35% (both as of 2026-09-18, StockAnalysis), meaning distributions far exceed accounting net income. That’s largely because option premium isn’t booked as “income” under standard accounting, so it doesn’t automatically mean principal erosion. Still, tracking the fund’s actual net asset value (NAV) trend over time is the more reliable way to judge whether capital is being preserved.
Q3. If you had to pick just one of the five, which is the safest starting point?
There’s no universal answer — it depends on the goal. For minimizing volatility while still collecting some income, JEPI (9.9% volatility, as of 2026-09-18) is the more conservative pick. If steady monthly cash flow is the primary objective, XYLD (10.44%-11.49% yield, 11.9% volatility) tends to be somewhat smoother than QYLD. RYLD’s -42.5% maximum drawdown makes it better suited as a small slice of a broader portfolio than as a standalone holding.