
The global robotics market was valued at roughly $108 billion in 2025 and is forecast to nearly quadruple to $416 billion by 2035, according to Precedence Research data cited by Global X (Global X, Dec 2025). Falling AI compute costs, rapid progress in humanoid robotics, labor shortages, aging demographics and reshoring are all cited as catalysts. What makes this theme tricky right now is that the ETF landscape itself is shifting: the fund launched in 2018 as the iShares Robotics and Artificial Intelligence Multi-Sector ETF (IRBO) now trades as the iShares Future AI & Tech ETF (ARTY), with a different ticker, name and underlying index (confirmed via StockAnalysis’ ARTY page — the old IRBO page URL now auto-redirects to ARTY, checked 2026-08-03). Its center of gravity has moved from pure robotics toward AI semiconductors and compute.
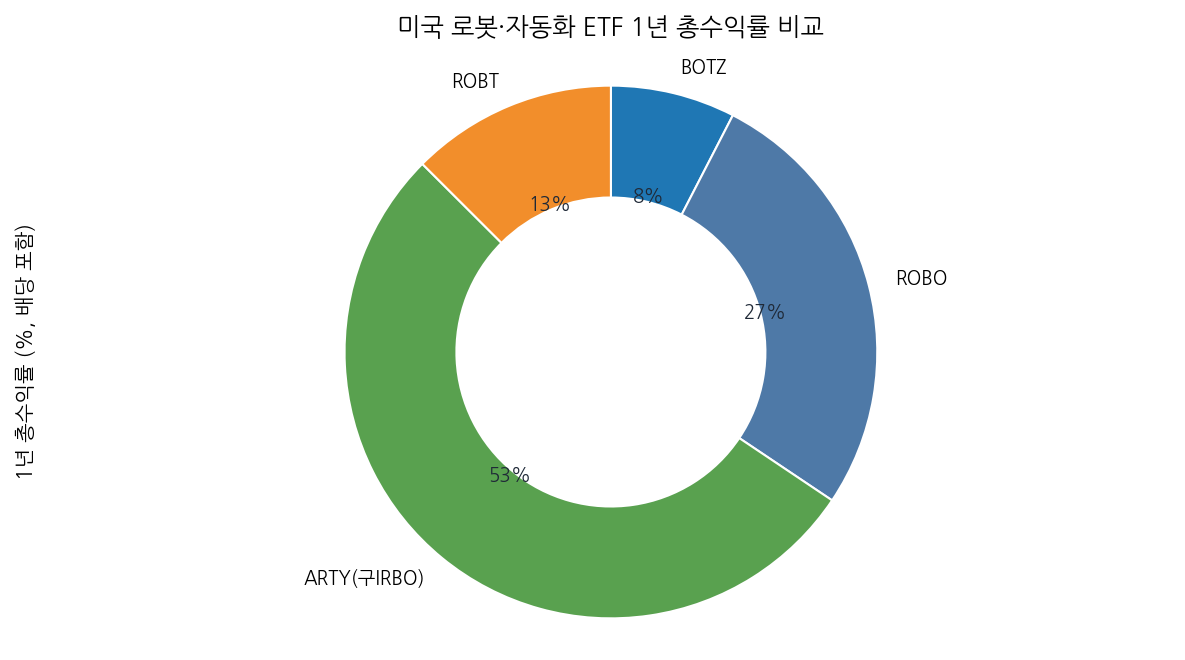
This article compares four US-listed robotics and automation ETFs — BOTZ (Global X Robotics & Artificial Intelligence ETF), ROBO (ROBO Global Robotics & Automation Index ETF), ARTY (iShares Future AI & Tech ETF, formerly IRBO) and ROBT (First Trust Nasdaq Artificial Intelligence and Robotics ETF) — on fees, holding concentration, returns and risk, using real reported figures. A direct comparison against Korea-listed robotics ETFs (KODEX K-Robot Active, TIGER Global AI&Robot, etc.) will follow in the next entry of this series.
1) At a glance
| Ticker | Issuer | Underlying Index | Expense Ratio | AUM | Holdings | Profile |
|---|---|---|---|---|---|---|
| BOTZ | Global X | Indxx Global Robotics & AI Thematic Index | 0.68% | $3.31B | 62 | Concentrated in large industrial-robotics hardware names |
| ROBO | ROBO Global (managed by Exchange Traded Concepts) | ROBO Global Robotics & Automation TR Index | 0.95% | $1.94B | 91 | Tiered weighting, broadly diversified across the automation value chain |
| ARTY (fmr. IRBO) | BlackRock (iShares) | Morningstar Global Artificial Intelligence Select Index | 0.47% | $3.50B | 65 | Rebranded in 2026; now concentrated in large-cap AI compute/semiconductor names |
| ROBT | First Trust | Nasdaq CTA Artificial Intelligence and Robotics Index | 0.65% | $0.725B | 121 | Equal-weighted within Engager/Enabler/Enhancer buckets; widest diversification |
2) The fee trap — expense ratio isn’t the whole cost
The annual expense ratio isn’t the only cost investors bear — the bid-ask spread at execution matters too. BOTZ, the largest fund here, posts a 30-day median spread of just 0.03%, while ROBT, the smallest, posts 0.20% — more than six times wider.
| Ticker | Expense Ratio | 30-Day Median Bid-Ask Spread | Real-world cost impact |
|---|---|---|---|
| BOTZ | 0.68% | 0.03% | Low — $3.31B AUM, top-tier liquidity |
| ARTY (fmr. IRBO) | 0.47% | Not separately disclosed | Low-to-moderate — largest AUM of the four ($3.50B), likely tight spreads |
| ROBO | 0.95% | Not separately disclosed | Moderate — 91 holdings means more rebalancing turnover to factor in |
| ROBT | 0.65% | 0.20% | Moderate-to-high — smallest AUM ($0.725B) and widest spread |
For investors buying these funds from outside the US, two additional layers of real cost apply that a headline expense ratio doesn’t capture: currency conversion spreads charged by your broker when converting local currency into USD, and US dividend withholding tax on distributions, which defaults to 30% for residents of countries without a tax treaty with the US and is typically reduced (often to 15%) for residents of treaty countries after filing a W-8BEN with your broker. The exact rate depends on your country of tax residence, so this article does not state a specific withholding rate — check with your broker or local tax treaty text.
3) Holding concentration (Top 5 by weight)
| Rank | BOTZ (2026-07-31) | ROBO (2026-08-03) | ARTY fmr.IRBO (2026-08-03) | ROBT (2026-07-30) |
|---|---|---|---|---|
| 1 | Keyence (Japan) 10.59% | Illumina 1.97% | TSMC (Taiwan) 5.19% | CCC Intelligent Solutions 1.98% |
| 2 | ABB (Switzerland) 9.33% | Rockwell Automation 1.91% | NVIDIA 4.95% | Illumina 1.93% |
| 3 | Fanuc (Japan) 9.13% | Ambarella 1.85% | Broadcom 4.95% | Oceaneering International 1.92% |
| 4 | NVIDIA 8.85% | GEA Group (Germany) 1.80% | AMD 4.85% | Cloudflare 1.80% |
| 5 | Intuitive Surgical 5.75% | Teradyne 1.70% | Micron Technology 4.34% | Palo Alto Networks 1.78% |
BOTZ’s top three holdings are all non-US companies — two Japanese (Keyence, Fanuc) and one Swiss (ABB) — meaning a US-listed, USD-denominated ETF carries substantial indirect exposure to the yen and Swiss franc through the underlying businesses. ARTY’s top five, by contrast, are dominated by US and Taiwanese semiconductor names, overlapping heavily with pure AI-chip ETFs like SOXX and SMH covered earlier in this series.
4) Returns by period
| Ticker | 1-Year Total Return | Annualized Since Inception | Inception Date |
|---|---|---|---|
| BOTZ | 9.01% | 9.87% | 2016-09-12 |
| ROBO | 31.93% | 9.94% | 2013-10-22 |
| ARTY (fmr. IRBO) | 63.16% | 15.10% | 2018-06-26 |
| ROBT | 14.90% | 7.94% | 2018-02-21 |
The 1-year spread is wide: ARTY (63.16%) and ROBO (31.93%) rallied hard, while BOTZ, weighted toward industrial-robotics hardware makers, returned just 9.01%. That gap tracks the 2025-2026 AI compute/semiconductor rally flowing straight into ARTY’s top holdings (TSMC, NVIDIA, Broadcom), while BOTZ’s core industrial names (Keyence, Fanuc, ABB) moved more modestly. For reference, Global X’s own NAV-based figures (as of 2026-06-30) show BOTZ returning 16.24% over 1 year, 9.96% annualized over 3 years and just 1.82% annualized over 5 years — notably higher than the 9.01% total return in the table above. Both figures describe a trailing “1 year,” but the reference dates sit more than a month apart (end of June vs. Aug 3), and the gap likely reflects price moves within that window rather than any difference in methodology. BOTZ’s 3-year and 5-year annualized figures aren’t directly comparable to the other three funds since equivalent same-period data isn’t available for them, but they do show BOTZ’s own longer-term trend has been far more muted than its 1-year number suggests.
5) Risk factors
- Strategy-drift / rebrand risk: ARTY’s transformation from IRBO shows that a fund’s ticker, index and investment thesis can change entirely over time. Always re-check current holdings before buying, especially for “robotics” funds.
- High-beta, high-concentration risk: BOTZ carries a beta of 1.68 versus the S&P 500 (Global X, as of 2026-07-31), ARTY 1.51 (StockAnalysis, as of 2026-08-03), and BOTZ’s top three holdings alone account for roughly 29% of assets.
- Theme overlap risk: ARTY now functions closer to an AI-semiconductor fund. Investors who already hold SOXX or SMH may end up with significant duplicate exposure despite ARTY’s “robotics” branding history.
- FX and geographic concentration: BOTZ’s top three holdings are Japanese and Swiss companies, so yen and Swiss franc moves flow indirectly into a USD-denominated fund’s returns.
- Liquidity risk: ROBT is the smallest fund here ($0.725B AUM) with the widest spread (0.20%), which can add up on frequent trading.
- Valuation risk: P/E ratios stand at 36.58x for BOTZ, 31.10x for ARTY, 29.17x for ROBO and 27.71x for ROBT (StockAnalysis, as of 2026-08-03), leaving all four exposed to a valuation reset if growth expectations cool.
6) A note for international investors
Beyond the fee and tax layers noted in Section 2, market access itself varies by country. Many brokers outside the US restrict retail access to certain US-listed ETFs under local securities regulations (for example, PRIIPs/KID rules across the EU and UK affect availability of some US-domiciled ETFs). Before allocating to any of these four funds, confirm with your own broker that the specific ticker is available for retail purchase in your jurisdiction, since availability changes independently of the fund’s own strategy or performance.
7) Bottom line — by investor profile
- Pure industrial-robotics hardware exposure: BOTZ — largest weighting toward core robotics manufacturers (Keyence, Fanuc, ABB), but watch the ~29% top-3 concentration and embedded JPY/CHF exposure.
- Broad diversification across the automation value chain: ROBO — 91 holdings, just 17.59% in the top 10, though the highest expense ratio (0.95%) of the four.
- Large-cap AI compute/semiconductor exposure: ARTY (fmr. IRBO) — highest 1-year return (63.16%), but understand you’re now buying an AI-semiconductor fund, not a robotics fund in the traditional sense.
- Widest possible diversification: ROBT — 121 holdings spread across Engager/Enabler/Enhancer categories, but confirm liquidity given its smaller AUM.
FAQ
Q1. I can’t find IRBO anymore — was it closed?
No, it wasn’t closed. It was renamed to the iShares Future AI & Tech ETF (ARTY), with a new ticker, name and underlying index (confirmed via StockAnalysis, checked 2026-08-03 — the old IRBO page URL now auto-redirects to ARTY). The old IRBO targeted robotics and AI broadly; ARTY is now concentrated in large-cap AI semiconductor names like TSMC, NVIDIA and Broadcom. If you specifically want robotics exposure, check current holdings before buying.
Q2. BOTZ and ROBO are both “robotics ETFs” — why is the concentration so different?
Different index construction. BOTZ is market-cap weighted, so large names like Keyence, ABB and Fanuc dominate — the top 10 holdings account for 60.19% of assets (StockAnalysis, 2026-08-03). ROBO uses a tiered weighting scheme across 91 holdings, keeping the top 10 at just 17.59%.
Q3. Is it too late to invest in the robotics/automation theme?
Global X cites Precedence Research projections of the robotics market roughly quadrupling by 2035, driven by falling AI compute costs and humanoid-robotics progress (Global X, Dec 2025). That said, this is issuer marketing material about a long-term forecast, not a guarantee — and as this article shows, P/E ratios ranging from 27.71x to 36.58x and a 1-year return spread from 9.01% to 63.16% across four funds in the same “theme” mean fund selection matters enormously.
This entry follows earlier pieces in this series on AI semiconductors, batteries, defense and healthcare ETFs. The next entry compares Korea-listed robotics ETFs directly against BOTZ.
1 thought on “US Robotics & Automation ETFs Compared (August 2026) — BOTZ vs. ROBO vs. ARTY (formerly IRBO) vs. ROBT”