📌 As of 2026-06-24 · Fund data sourced from official issuer pages and StockAnalysis aggregations. Educational content; not investment advice.
Why Lithium & Battery ETFs Are Back on the Table in 2026
The lithium thesis was left for dead in 2022–2024: spot lithium carbonate (LCE) collapsed roughly 80% from its 2022 peak, EV demand cooled, and battery-themed ETFs underperformed broad equities by 30–50 percentage points. The narrative flipped in early 2026. Four structural catalysts kicked in at once: (1) CATL’s mass-production of LFP and semi-solid cells, (2) residual US IRA subsidies for domestic battery investment, (3) the EU’s reaffirmed 2035 ICE ban, and (4) explosive ESS demand from AI data centers and humanoid robotics. Spot LCE has rebounded roughly 60% from the Q1 2026 low to around $16,000/tonne. Lithium ETFs went from forgotten to leading.
This piece compares the three most accessible US-listed lithium and battery ETFs — LIT (Global X), BATT (Amplify), and ILIT (iShares) — across structure, expense ratios, real total cost of ownership, top-holdings concentration, point-in-time returns, and risk vectors. We use the same “advertised expense ratio vs. real TER” framework we applied to our earlier US AI & semiconductor ETF deep dive (SOXX/SMH/SOXQ/AIQ/BOTZ).
At-a-Glance Comparison
| Metric | LIT | BATT | ILIT |
|---|---|---|---|
| Issuer | Mirae Asset Global X | Amplify ETFs | BlackRock iShares |
| Inception | 2010-07-22 | 2018-06-06 | 2023-06-21 |
| Index | Solactive Global Lithium | EQM Lithium & Battery Tech | STOXX Global Lithium Miners & Producers |
| Strategy | Passive (modified market-cap) | Passive (capped market-cap) | Passive (market-cap) |
| Expense Ratio | 0.75% | 0.59% | 0.47% |
| AUM | ~$1.91B | ~$134M | ~$22M |
| Holdings | 41 | ~90 | ~53 |
| Coverage | Mining + refining + cells + EV OEMs | Lithium + nickel + cobalt + copper full value chain | Pure-play lithium miners & producers |
| Avg daily volume | ~600k+ shares | 50–100k shares | 10–30k shares (low liquidity) |
Although all three are labeled “lithium / battery,” their exposures differ sharply. LIT gives the widest end-to-end exposure — from raw-material miners through cell makers to Tesla. BATT reaches beyond lithium into nickel, cobalt, and copper miners, behaving closer to a “battery-metal basket.” ILIT is a focused lithium-miners pure play, which makes it the highest-beta to lithium spot prices.
The Fee Trap — Advertised vs Real TER
The expense ratio printed on the fact sheet is only the daily NAV haircut. The “real TER” you actually pay also includes:
- Bid/ask spreads — wider on low-liquidity ETFs
- Brokerage commission on entry/exit
- 15% withholding on US-sourced dividends (for non-US investors)
- Capital gains tax on sale
| Cost layer | LIT | BATT | ILIT |
|---|---|---|---|
| Expense ratio | 0.75% | 0.59% | 0.47% |
| Avg spread (est.) | 0.05% | 0.15% | 0.30% |
| Real TER (fee + spread) | ~0.80% | ~0.74% | ~0.77% |
On paper ILIT (0.47%) looks like the cheapest, but once spreads are baked in all three settle around 0.74–0.80%. ILIT’s wider spread — roughly 6× LIT’s — comes from being a $22M fund with a few tens of thousands in daily volume. On a $100k holding for one year, the cost gap between the three is roughly $60 per year. The fee differential alone is not a sufficient reason to pick ILIT over LIT.
Holdings Concentration — The Real Bet You’re Making
LIT — Top 10
Rio Tinto 20.08% · Naura Technology 6.64% · TDK 6.40% · Panasonic 5.83% · Albemarle 5.13% · Tesla 4.11% · Samsung SDI 3.93% · EVE Energy 3.87% · CATL 3.64% · Pilbara Minerals 3.24%. Top 10 = 62.87% of NAV (Global X fact sheet, 2026-03-31).
The headline risk inside LIT is the 20% Rio Tinto position. Rio’s $6.7B acquisition of Arcadium Lithium (closed March 2025) made the company the largest Western lithium-mining consolidator, and as a result LIT now carries an unusually concentrated single-issuer beta to lithium prices.
BATT — Top 10
BHP 6.97% · Tesla 6.74% · CATL 6.56% · Freeport-McMoRan 5.58% · Bloom Energy 5.35% · BYD 4.32% · TDK 3.56% · Grupo Mexico 2.74% · Teck Resources 2.39% · Resonac 2.29%. Top 10 = ~46.5% (StockAnalysis, 2026-06-24).
BATT enforces a per-name cap near 7%, so concentration is materially lower than LIT. But ~17.7% of the fund sits in copper/nickel/zinc miners (BHP, Freeport, Grupo Mexico, Teck). BATT therefore behaves more like a diversified battery-metal basket and tracks the broader mining cycle as much as the EV cycle.
ILIT — Top 10
Pilbara Minerals 7.94% · SQM 7.93% · Arcadium (ex-Allkem) 7.68% · Albemarle 7.65% · Arcadium (ex-Livent) 7.19% · Sigma Lithium 5.09% · Liontown 4.83% · Cosmo AM&T 4.78% · Lithium Americas 4.74% · SK IE Technology 4.42%. Top 10 = 62.25% (iShares fact sheet, 2026-03-31).
ILIT is the cleanest pure-play. There is no Tesla, no CATL, no Samsung SDI — only miners and primary lithium producers. That structure delivered the strongest 1-year total return of the three (+148.48%) as lithium spot rebounded, but also implies the deepest drawdown risk if the metal rolls over again.
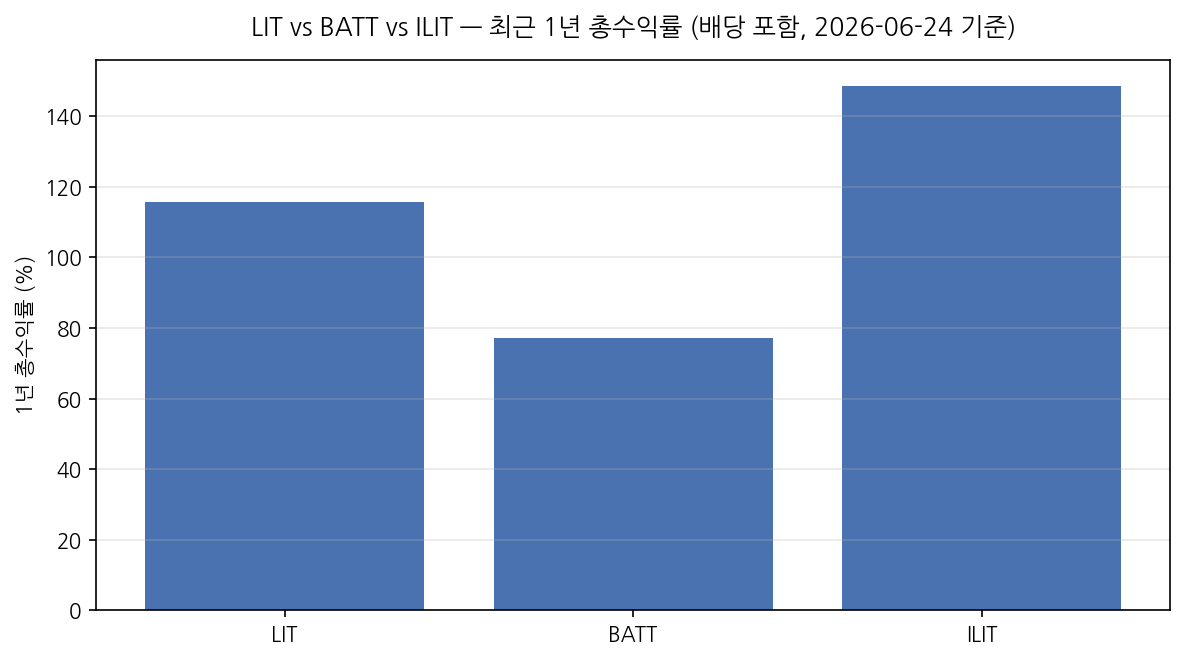
Point-in-Time Returns (with dividends, as of 2026-06-24)
| Period | LIT | BATT | ILIT |
|---|---|---|---|
| 1-year total return | +115.60% | +77.07% | +148.48% |
| 3-year annualized (NAV) | +5.61% | n/a | n/a |
| Since inception (CAGR) | +7.25% | -1.05% | +57% cumulative |
BATT’s negative since-inception CAGR is a clean case study for theme-ETF entry timing: the fund launched at the 2018 lithium peak and ate the full 2022–2024 downcycle. LIT, the oldest of the three, has now lived through one complete EV/lithium cycle and printed a respectable +7.25% CAGR — closer to a broad commodity index than to a single-theme bet.
Risk Vectors
- Lithium-price volatility. LCE traded $80k → $10k → $16k from 2022 to 2026. ETF performance is largely a derivative of this spot path.
- China concentration. All three funds carry meaningful CATL, BYD, and EVE Energy weight. US–China trade escalation is a direct headwind.
- Single-name concentration. LIT’s Rio Tinto position is 20%; ILIT’s post-merger Arcadium block is ~15%. Holding both means roughly 30–40% combined exposure to Rio Tinto.
- EV demand risk. IRA rollback risk, sluggish European EV demand, and Chinese price wars all compress cell-maker margins.
- Liquidity. ILIT trades 10–30k shares/day. Market orders can cost >1% slippage at size.
- FX. No currency hedge; non-USD investors carry full FX risk.
US vs Korea — Coming Next
The next post in this series covers the Korean-listed battery ETFs (TIGER 2차전지테마, KODEX 2차전지산업, TIGER Global Lithium & Battery SOLACTIVE) and benchmarks them against LIT. Korean ETFs concentrate on LG Energy Solution, Samsung SDI, SK On, and EcoPro BM — effectively a “Korean Big-4 battery basket.” Expense ratios are roughly half of LIT, but diversification is meaningfully lower. Reading both posts side-by-side highlights the structural choice between a global lithium-cycle bet and a Korean cell-maker bet.
Conclusion — Pick by Investor Profile
- Long-term, diversified buy-and-hold: LIT. Largest AUM, longest track record, broadest value-chain exposure.
- Battery-metal cycle bet: BATT. If you want copper and nickel along with lithium.
- High-conviction lithium rebound bet: ILIT. Highest beta, highest 1-year return, but $22M AUM means closure risk is a real consideration.
- First-time theme ETF buyers: none of the three should exceed ~5% of a diversified portfolio. Sitting out is a legitimate option.
FAQ
Q1. Does pairing LIT and ILIT diversify my exposure?
Not effectively. Both funds carry concentrated Rio Tinto exposure (~20% in LIT, ~15% in ILIT after the Arcadium merger). Combining them produces a single-name exposure of 30–40%. LIT + BATT is a better diversifier — the only major overlaps are Tesla, CATL, and TDK.
Q2. Should I worry about an EV demand slowdown?
Lithium ETFs cover more than EVs. ESS (data-center backup, grid-scale solar/wind storage), power tools, and humanoid robotics are growing battery end-markets. 2026 ESS demand is roughly 35% of EV demand but growing twice as fast. The investment case is best framed as “electrification + grid” rather than “EV pure play.”
Q3. ILIT has only $22M AUM. Is closure a risk?
BlackRock historically closes ETFs that linger below $25–50M for extended periods. ILIT has been rising, but the AUM threshold is worth monitoring. Holders should watch quarterly AUM disclosures; closure means a forced redemption and a potential taxable event.
Practical Buying Notes for Non-US Investors
Korean, Japanese, and Chinese investors typically buy LIT, BATT, and ILIT through domestic brokerage US-stock accounts. A few details matter at execution time. First, settlement runs on T+1 in the US, so cash from a sale is only available the next trading day — plan rebalances accordingly. Second, domestic brokers usually charge an additional ~0.25% foreign-equity commission on top of any spread, which is already baked into our real TER table above. Third, fractional-share support varies: if your broker requires whole shares, the $80+ price per LIT share constrains the smallest practical position size. ILIT, at a lower share price but lower liquidity, swings the trade-off the other way. Fourth, dividend reinvestment plans (DRIPs) are commonly unavailable for foreign holders of US ETFs; dividends are paid in USD cash net of the 15% withholding, and reinvestment must be done manually.
For tax planning, Korean residents face a 22% capital-gains tax above the KRW 2.5M annual exemption on foreign-equity gains, while losses can offset gains within the same fiscal year. Japanese residents fall under separate-taxation at 20.315% on capital gains and dividends combined. Chinese mainland residents trading via approved cross-border channels are usually taxed on dividend income only. The right tax wrapper changes which fund is the most efficient choice for you; the headline 1-year return numbers above are pre-tax.
What to Watch in H2 2026
- LCE spot price. A break above $20,000/tonne would likely propel ILIT toward another leg up; a fall back below $12,000 would reverse most of the 2026 gains.
- Rio Tinto Arcadium integration milestones. Because Rio is 20% of LIT and roughly 15% of ILIT, any operational issue at Arcadium’s Argentine assets becomes a top-down LIT/ILIT shock.
- US Treasury IRA guidance. Final battery-component sourcing rules will determine which Chinese cell makers (CATL, BYD, EVE) retain US OEM access.
- EU CRMA approval list. The Critical Raw Materials Act’s strategic-project designations will influence Western lithium miner valuations directly.